Economic Development
NWGRC Member Counties













THE NORTHWEST GEORGIA REGIONAL OVERVIEW
OVERVIEW
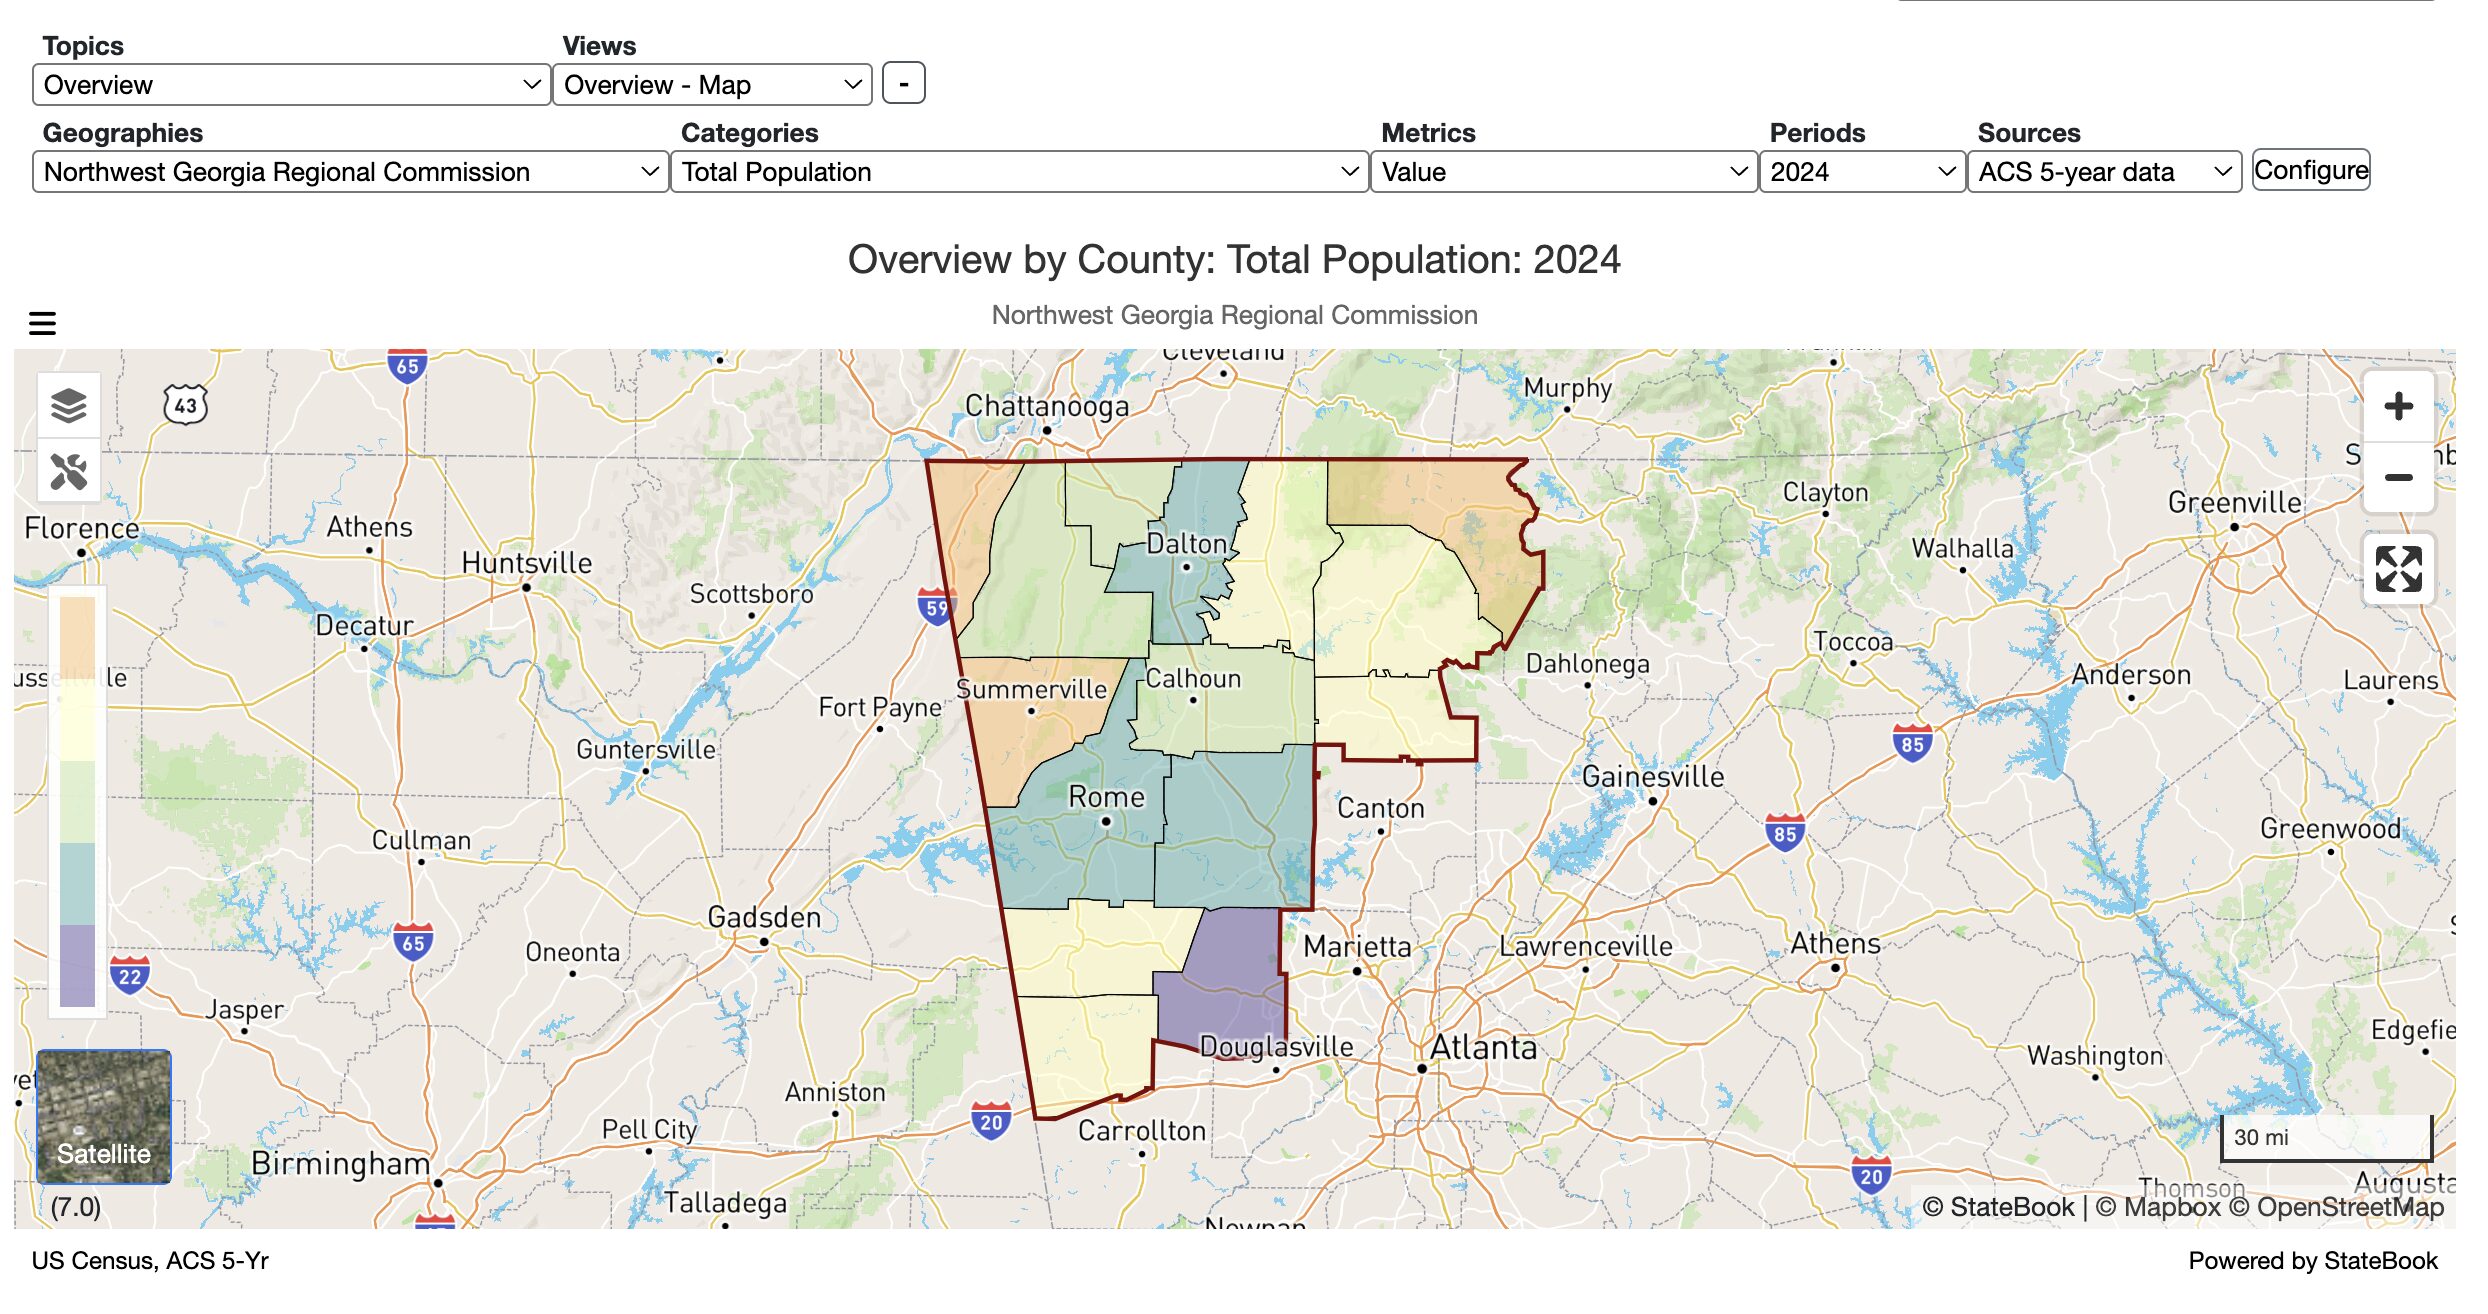
The Northwest Georgia Regional Commission’s district consists of 15 counties (Bartow, Catoosa, Chattooga, Dade, Fannin, Floyd, Gilmer, Gordon, Haralson, Murray, Paulding, Pickens, Polk, Walker, and Whitfield) and the forty-nine cities located within these counties. The region is predominantly rural but continues to see substantial growth due to its proximity to Atlanta and Chattanooga. The Interstate 75 corridor runs north-south through the eastern part of the Region connecting these two metropolitan areas. This corridor has seen significant growth over the past decade and growth in the region is projected continue along I-75 at a faster rate than other areas
Geography
Northwest Georgia is located in the southern foothills of the Appalachian Mountains in Georgia’s Ridge and Valley, Blue Ridge Mountains, and Piedmont geographical regions. The region consists primarily of rolling hills with valleys and tall hills, ridges, and mountains running primarily northsouth. This geography makes east-west connectivity and regional development somewhat challenging. However, the geography of the area also creates some of the most scenic views in the state.
Core Based Statistical Areas (CBSA)
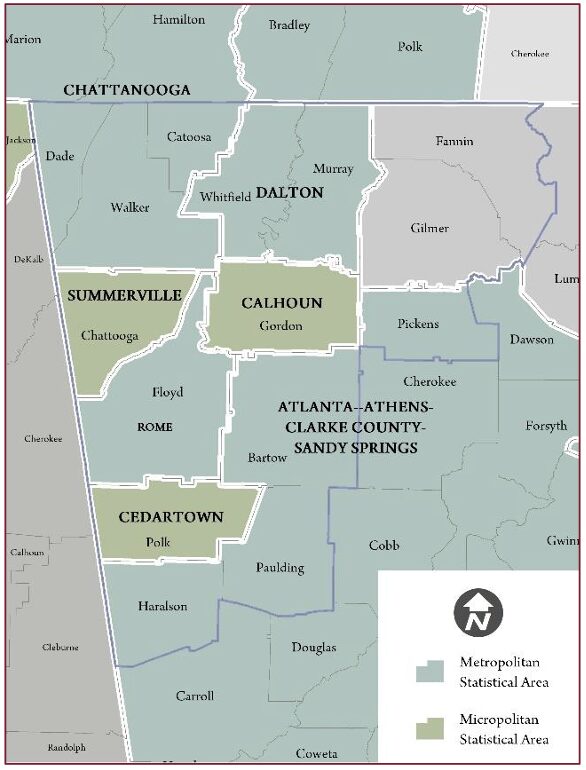
A Core Based Statistical Area (CBSA) is a geographic area defined by the U.S. Office of Management and Budget (OMB) that consists of one or more counties anchored by an urban center of at least 10,000 people plus adjacent counties that are socioeconomically tied to the urban center by commuting. CGSAs include both metropolitan and micropolitan statistical areas (MSA). The far northwestern counties of Dade, Walker, and Catoosa are located in the Chattanooga MSA. The southern counties of Haralson, Paulding, and Bartow, as well as Pickens County, are located in the Atlanta area MSA. Whitfield and Murray counties share the Dalton MSA, and Rome is in a metropolitan area by itself. Chattooga, Gordon, and Polk counties are all in single county micropolitan areas, and Fannin and Gilmer are not located in either a metropolitan or micropolitan statistical area.
ECONOMY
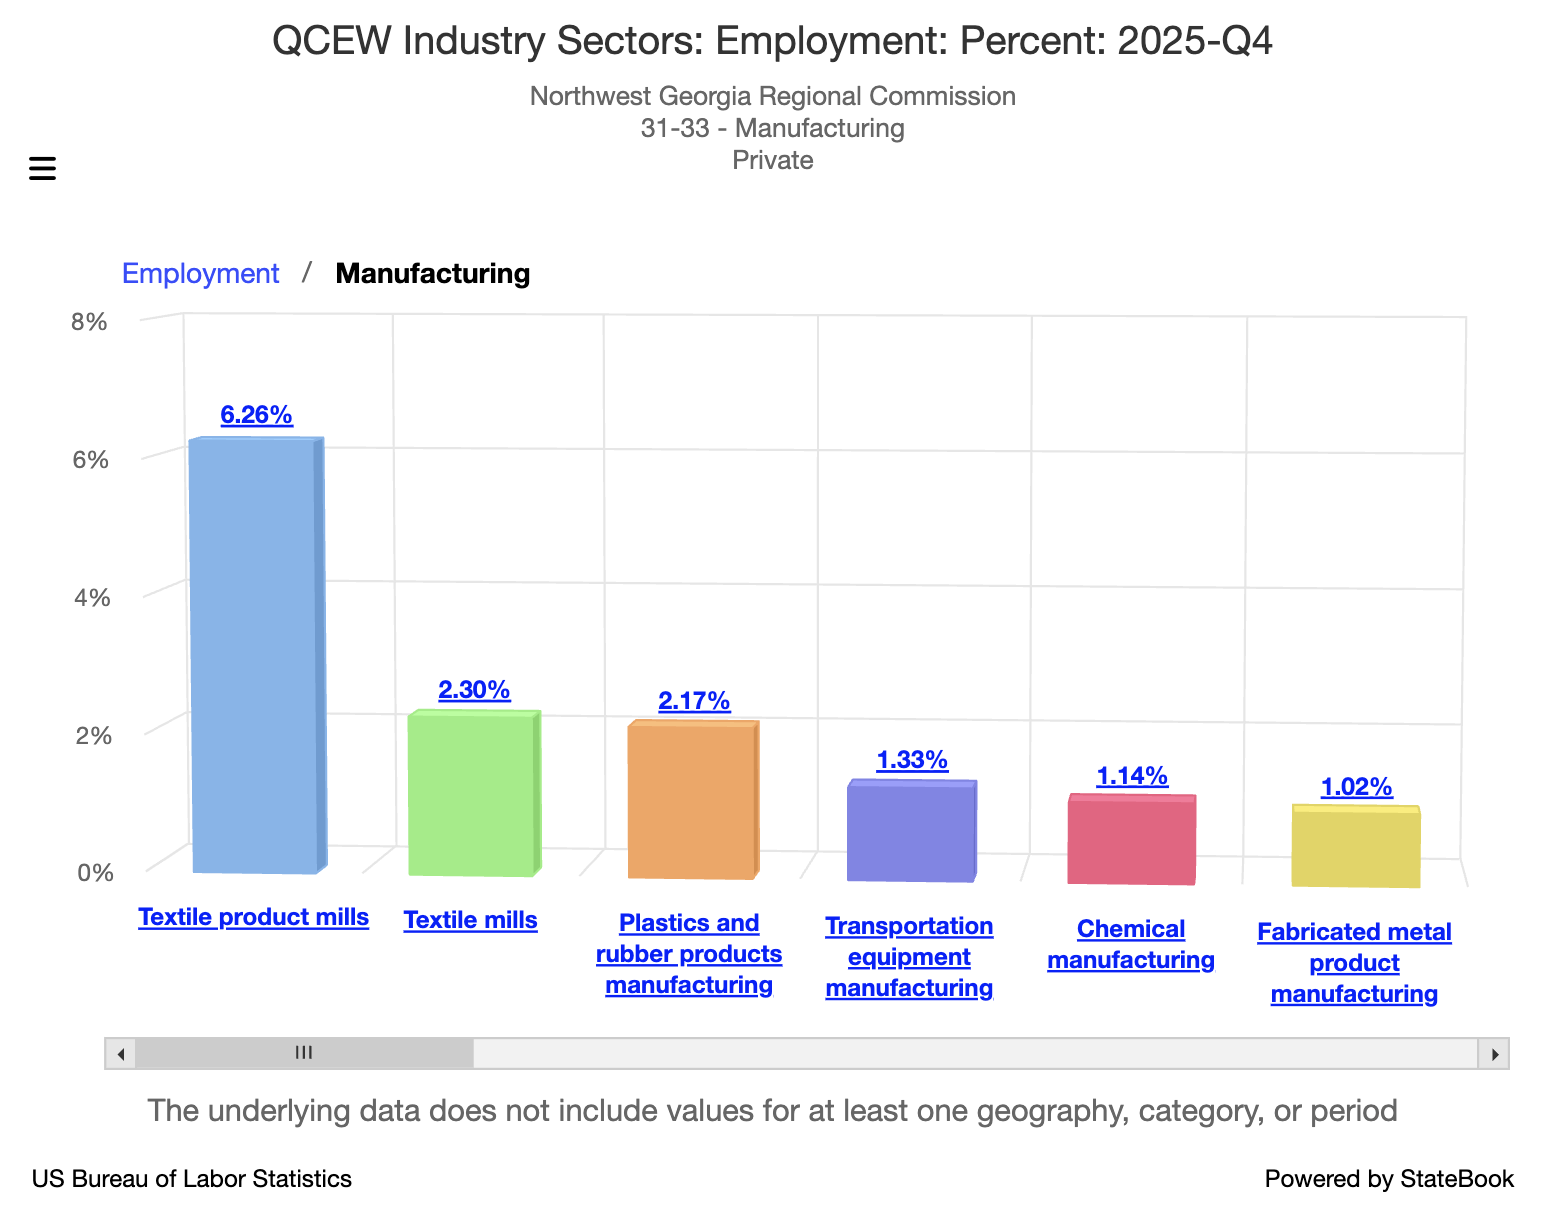
Traditionally, the region’s economic base has depended upon the manufacturing sector (28.5% of the region’s employment in 2021), dominated by floor covering industry. Although, the collapse of the housing industry in 2007 dramatically reduced demand for floor covering products and lead to several plant closings in the region, the floor covering industry still dominates the economy in several of northwest Georgia’s counties.
Manufacturing in northwest Georgia continues to change its production model. Moving from a highly labor-intensive, hands-on production system to an automated system, where skilled technicians guide machines using computer programming or perform manual tasks with robotic assistance. In this changing job market, prospective employees must have or be able to learn the required skill set including engineering, computer technology, and programming. Additionally, the labor market appears to be continuing to trend toward a more logistics and services focused economy.
Industry Mix
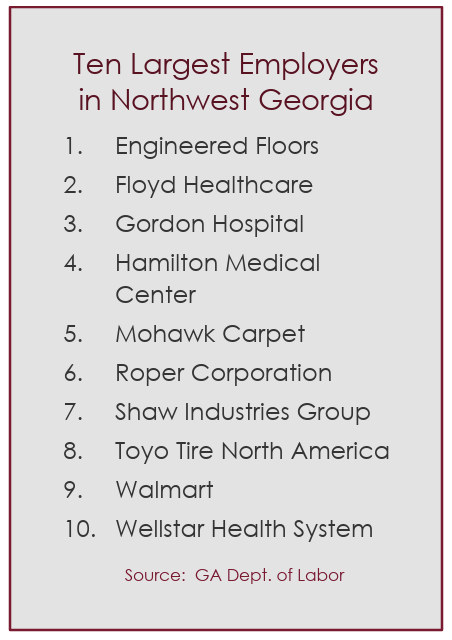
Northwest Georgia’s economy continues to diversify, moving to a more serviceoriented economy. According to the U.S. Bureaus of Census, in the past five years the goods producing industry sector has decreased its share of northwest Georgia’s economy by 0.6%; decreasing from 29.2% of the workforce in 2016 to 28.6% in 2021. During the same time period, the service providing industry has increased its share of the economy by 1.3%; growing its percentage of the workforce from 55.4% in 2016 to 56.7% in 2021. The unclassified and government sectors saw decreases of 0.1% and 0.7%, respectively. Overall, the regional’s workforce grew by 10,631 employees in the past five years; increasing from 259,072 in 2016 to 267,703 in 2021. Healthcare has become a dominant industry in Northwest Georgia, with four of the top ten employers in the region representing this sector. While the flooring industry remains strong with three (Engineered Floors, Mohawk Carpet, and Shaw Industries) of the top ten employers in the region representing this economic sector.
In the goods producing sector, over the last five years the agriculture, forestry, fishing, & hunting industry saw the highest percentage increase, which grew by 26.6%. Manufacturing grew by only 0.9%. Overall, the service providing sector grew by 9,095 jobs, or 6.3% in the last five years. The Arts, Entertainment, & Recreation industry grew the most in terms of percentage in this sector at 33.2%.
Health Care and Social Assistance had the largest increase in number of jobs at 3,299. Professional,
Scientific, and Technical Services also saw a significant increase in employees during this time period growing by 24.6% and 1,633 jobs. Overall, the number of jobs in Northwest Georgia grew from a total of 259,072 in 2016 to 269,822 in 2021. This represents a five-year increase of 10,750 or approximately 5.2%.

Economic Distress
The Northwest Georgia Economic Development District is performing below the national average in each of the economic distress criteria. This indicates that, although the region recovered from the Great Recession, northwest Georgia has still not achieved socioeconomic parity with the nation.
Unemployment Rate
The 24-Month Unemployment Rate for Northwest Georgia is 5.56%, which is 0.17% lower than the national rate. Four counties in the region (Catoosa, Dade, Fannin, and Pickens) have a 24-month unemployment rate of less than 4%. Two counties have 24-month unemployment rates of over 6%, and the county with the highest 24-month rate is Murray County, which has a rate of 6.23%.
Per Capita Income
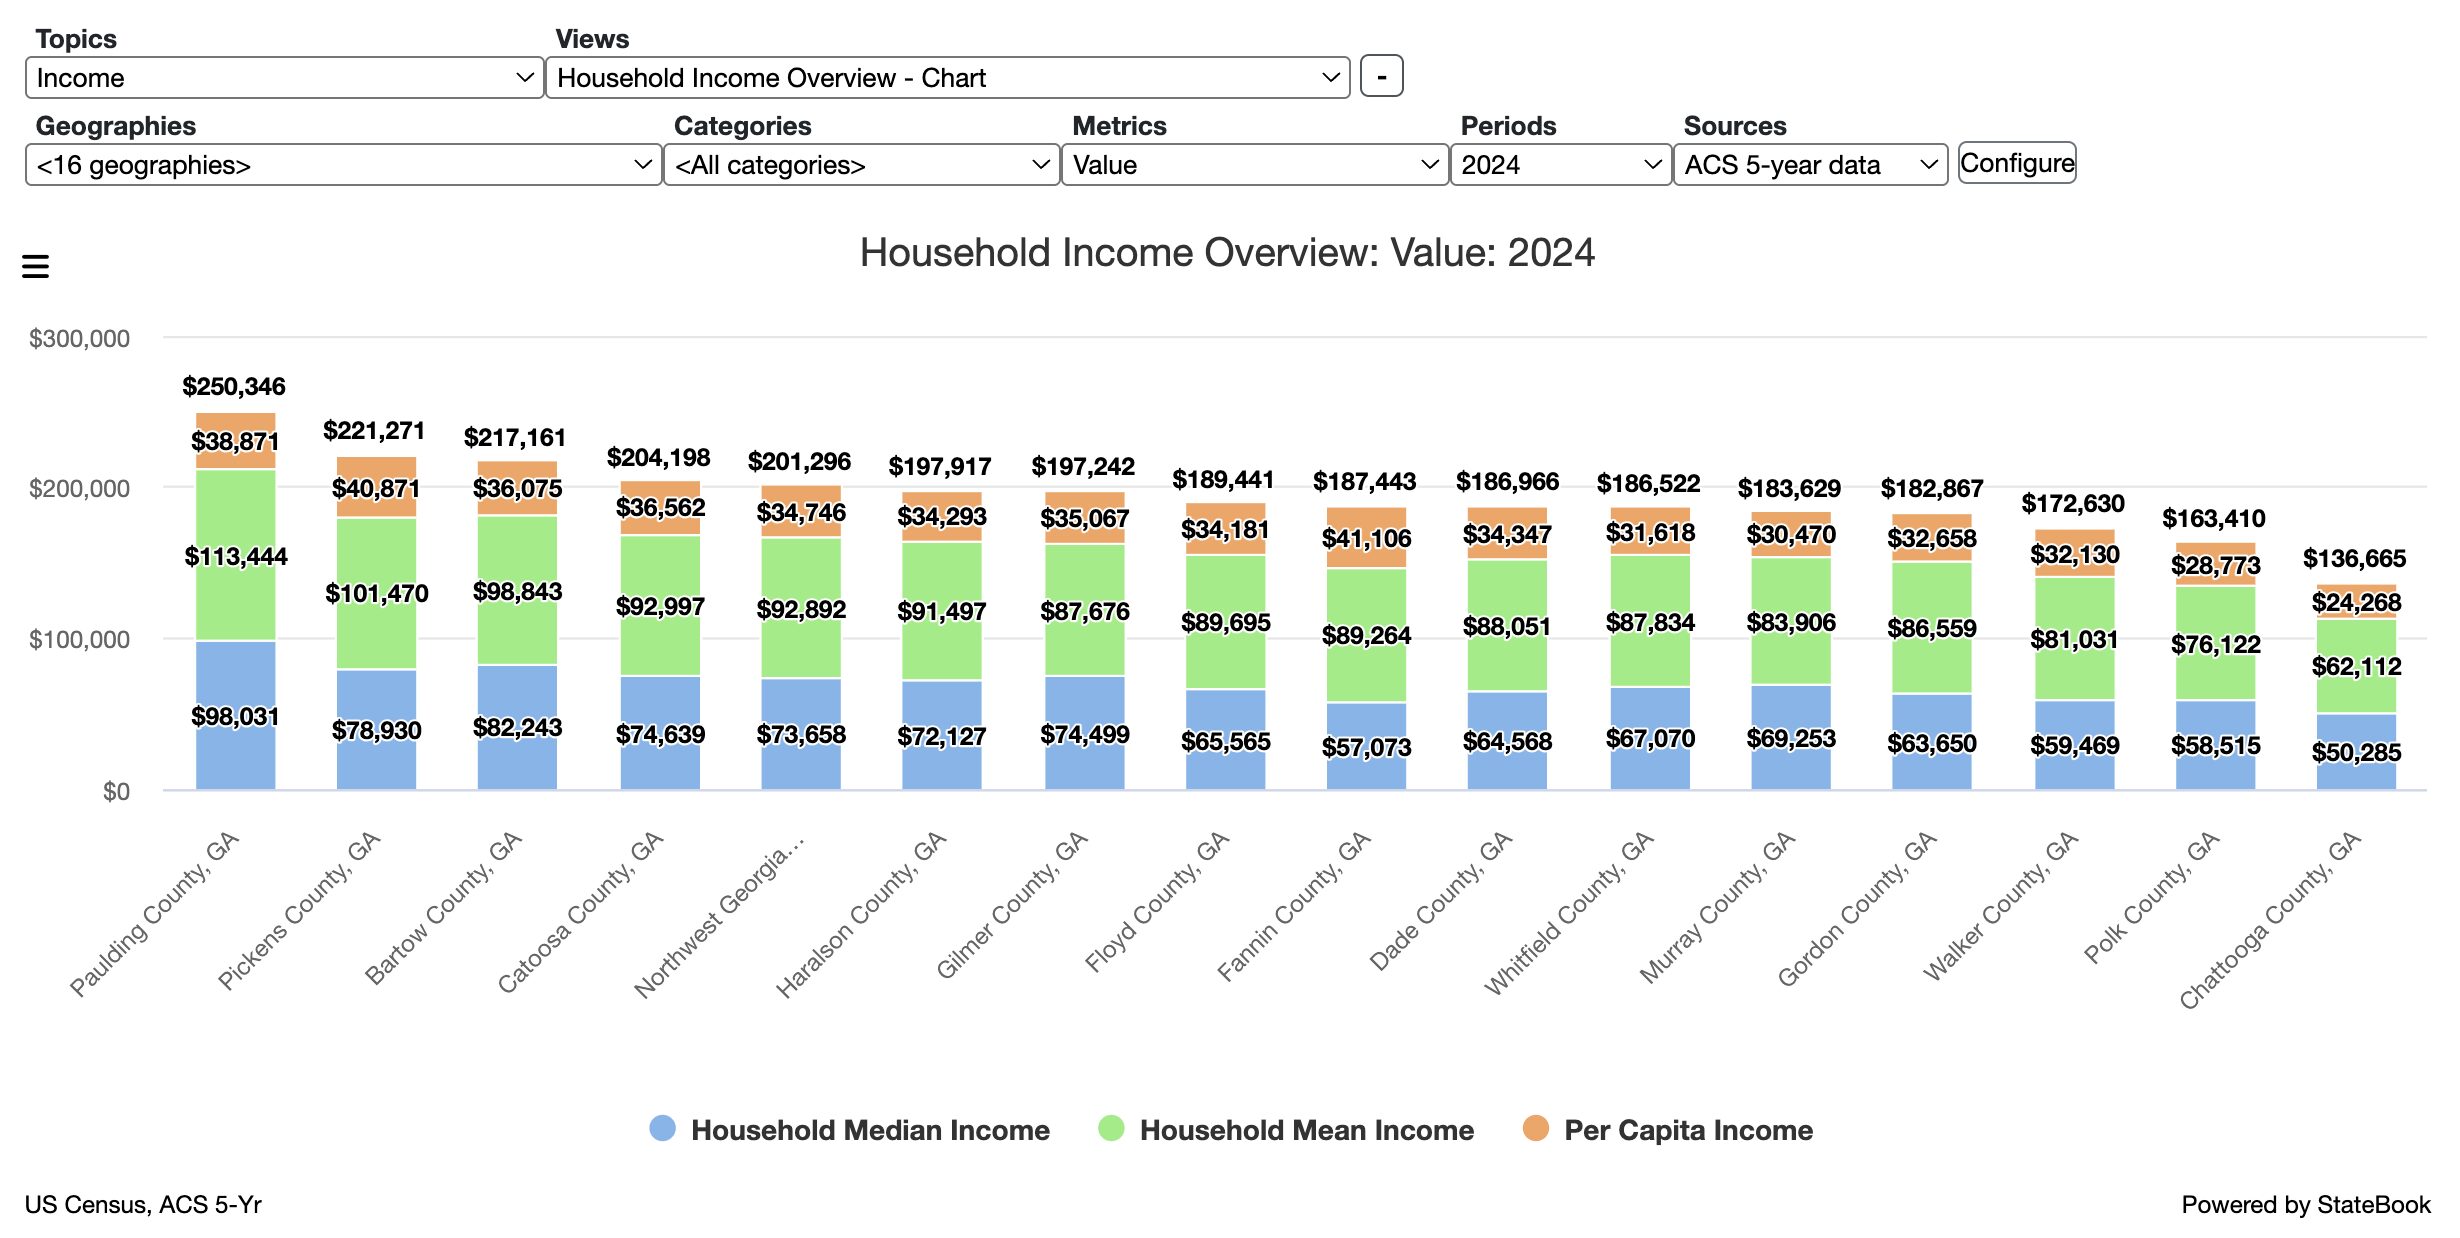
The 2020 Per Capita Personal Income calculated by the U.S. Bureau of Economic Analysis (BEA) for the region is $37,683, which is only 66.7% of the national average. None of the fifteen counties in Northwest Georgia has a per capita personal income equal to, or greater than, the national per capita income of $56,490.

Mark, these are the settings I used to create this chart, along with selecting all three categories of data (median, mean, and per capita income).